Fig. 2.

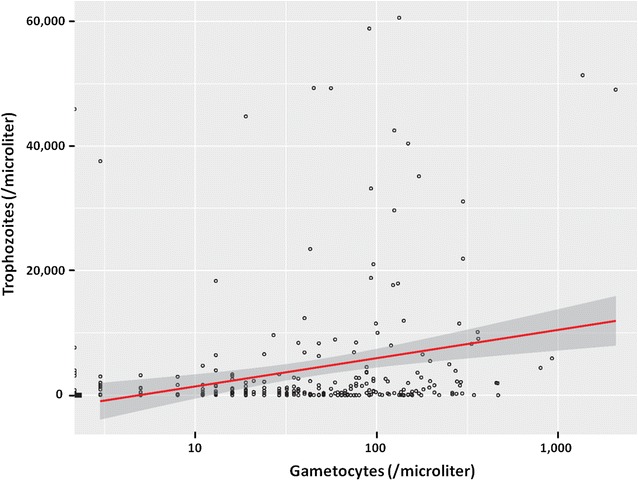
Relationship between gametocyte and trophozoite densities. The line indicates the best linear model and the shaded area the 95% confidence interval

Relationship between gametocyte and trophozoite densities. The line indicates the best linear model and the shaded area the 95% confidence interval