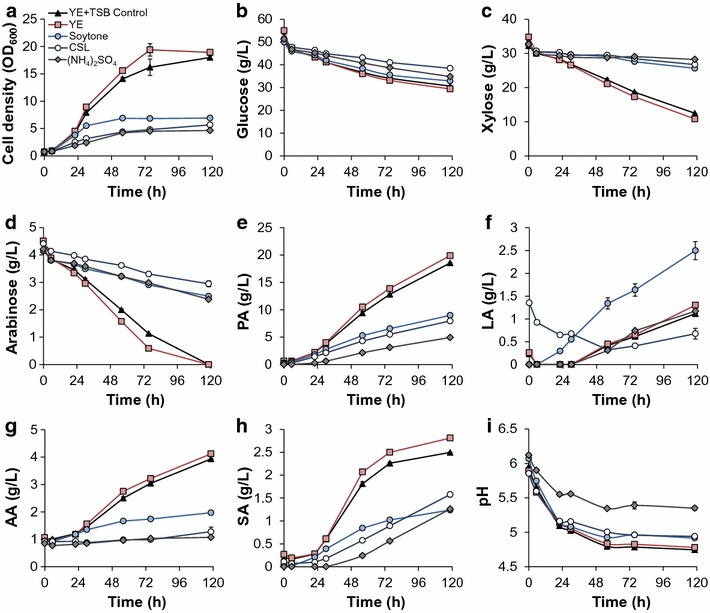
Fig. 4.

Time course fermentation profiles of P. acidipropionici under different nitrogen sources in serum bottles. Scatter plots show a cell growth (OD600), b glucose utilization, c xylose utilization, d arabinose utilization, e PA production, f LA production, g AA production, h SA production, i pH. The nitrogen source in the control case contains both YE and TSB
