
FIGURE 5.
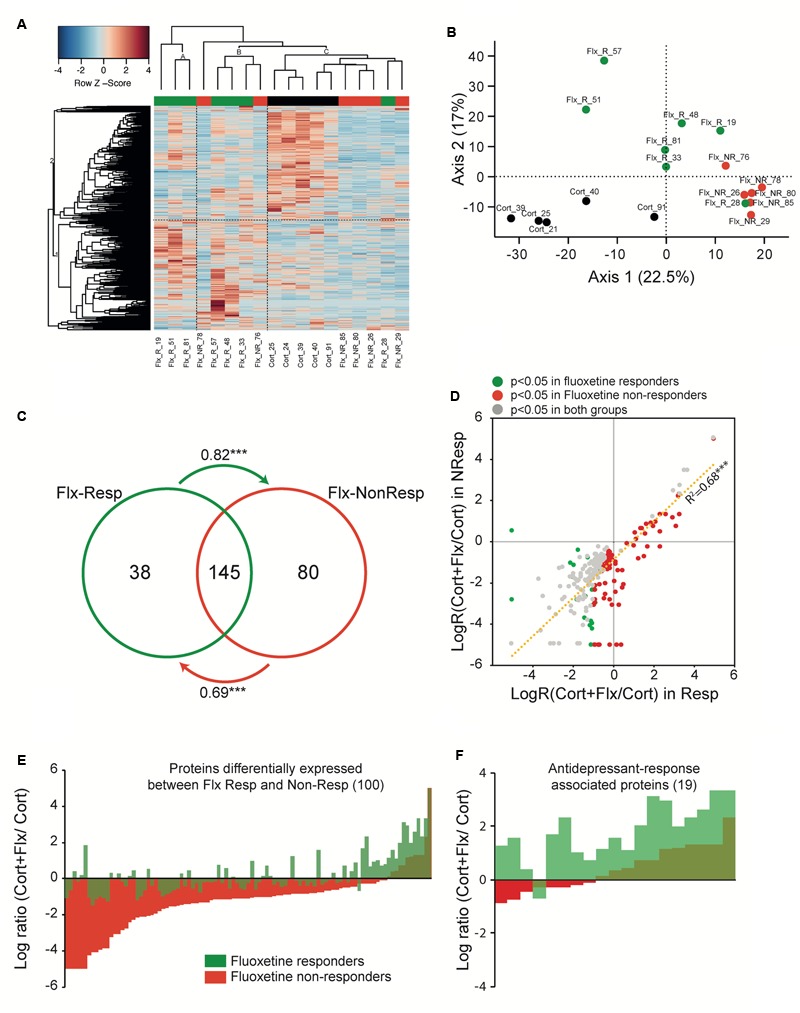
Peripheral proteomic changes after fluoxetine exposure in responders and non-responders. (A) Hierarchical bivariate clustering of expression profiles of animals (column) and proteins (rows) depicts the differences between CORT/V (black rectangle), CORT/Flx-R (green rectangle), and CORT/Flx-NR (red rectangle) groups. An animal’s expression is red for above-average values, and blue for below-average values. (B) Principal Component Analysis of expression profiles revealed 2 main axis separating results. (C) Venn diagram of protein levels with significant fluoxetine effect in CORT/Flx-R and CORT/Flx-NR groups. Changes affects massively common proteins between these two groups. Changes associated solely with CORT/Flx-R (38) or CORT/Flx-NR (80) strongly correlated between each other, as indicated by the arrows. Arrows indicate directional correlations between changes in protein expression for protein identified significant in one group (origin of arrow) and changes for the same protein in the other group (end of arrow). (D) Overall directional changes of protein expression were strongly correlated between groups. (E) Hundred proteins were observed significantly differentially expressed between CORT/Flx-R and CORT/Flx-NR groups, however (F) only 19 out of 100 could be associated with response to fluoxetine. ∗∗∗p < 0.0001 after Pearson χ2 correlation analysis.