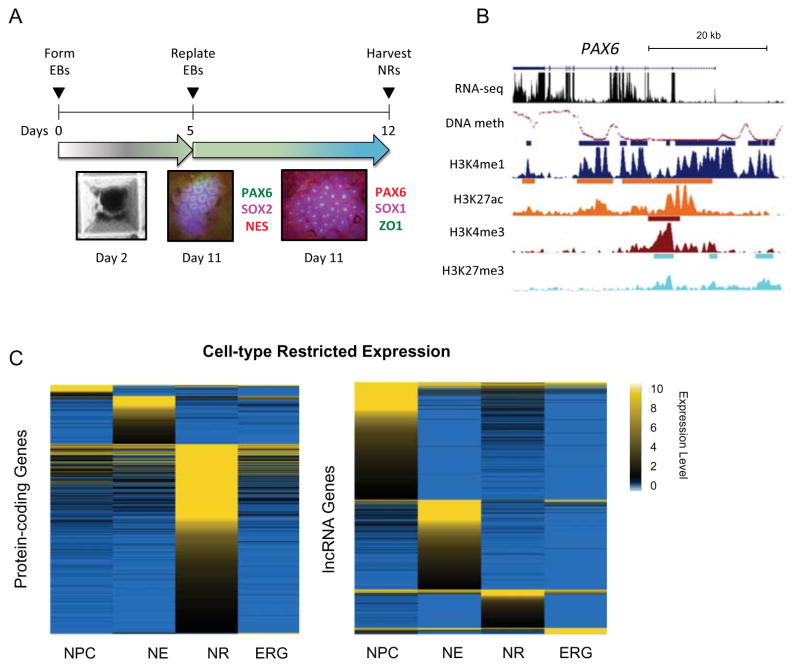
Figure 1. Distinct neural rosette transcriptional profiles compared to 2D neural stem cells.
(A) Top: schematic of the neural rosette differentiation protocol. Bottom: Immunostaining for neural markers in NRs at day 11 of differentiation. (B) UCSC Genome Browser snapshot of PAX6 locus (chr11:31,800,000–31,850,000) showing normalized signals of DNA methylation level (mCG/CG), RNA-seq (read count expressed as TPM), and ChIP-seq reads (RPKM, input normalized). ChIP-seq peak calls are shown as bars above each track. (C) Heatmap representation of expression levels (TPM) of entropy-based cell-type specific protein-coding (left) and lncRNA (right) genes. See related Supplemental Experimental Procedures, Figure S1 and Table S1.

