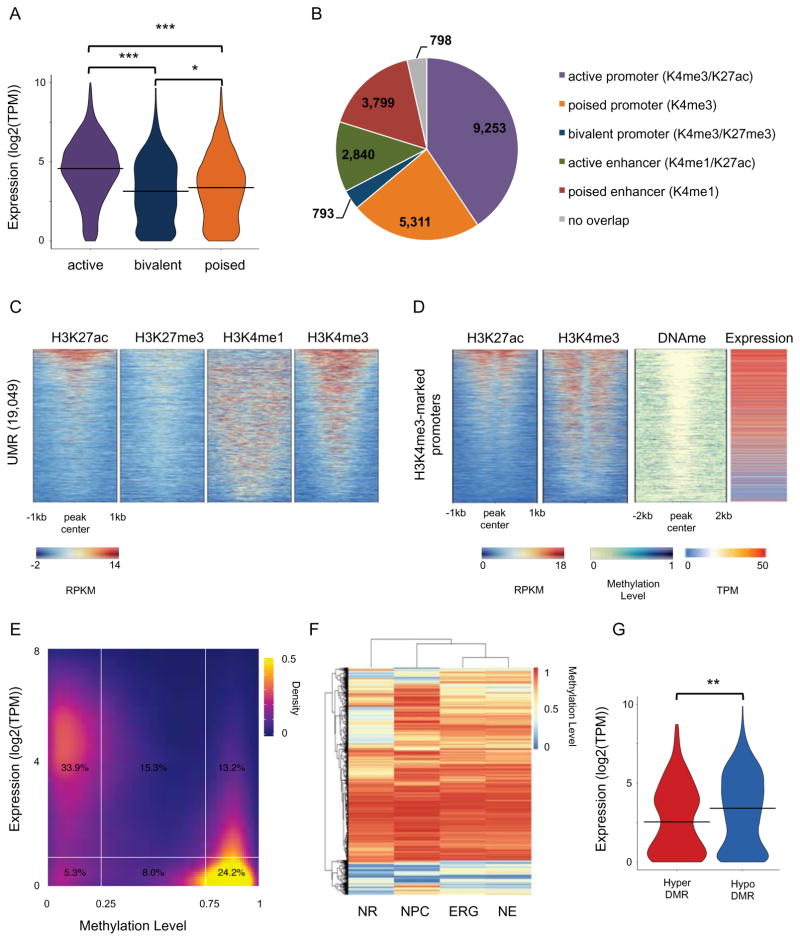
Figure 2. Epigenomic landscapes at neural rosette promoters.
(A) Violin plot of distribution of the expression values (log2(TPM)) of genes for active (H3K4me3/H3K27ac), poised (H3K4me3 only) and bivalent (H3K4me3/H3K27me3) promoters. *** T-test p-value < 0.0001. * T-test p-value ≤ 0.01. (B) Pie chart showing overlap of UMRs with chromatin-marked promoters and enhancers. (C) Heatmap representation of ChIP-seq signal intensity (RPKM, input normalized) for H3K4me1, H3K4me3, H3K27me3 and H3K27ac over 2kb windows centered at UMRs. (D) Heatmap representation of ChIP-seq signal intensity (RPKM, input normalized) for H3K4me3 and H3K27ac over 1kb windows centered at TSS, DNA methylation levels over 2kb windows centered at TSS, and gene expression (TMP) for H3K4me3-marked promoters. (E) Density plot showing gene expression (log2(TPM)) and DNA methylation levels for all promoters (defined as +/− 1kb around TSS; Gencode 19). (F) Heatmap and clustering visualization of aggregate mC levels (mCG/CG) in DMRs (delta-mC > 0.2) from all comparisons for positions with > 5X coverage in all cell types. 31,395 DMRs are shown in the heatmap. (G) Violin plot of distribution of the expression values (log2(TPM)) of genes which promoters harbour a DMR. ** T-test p-value < 0.001. See related Figure S2 and Table S2.

