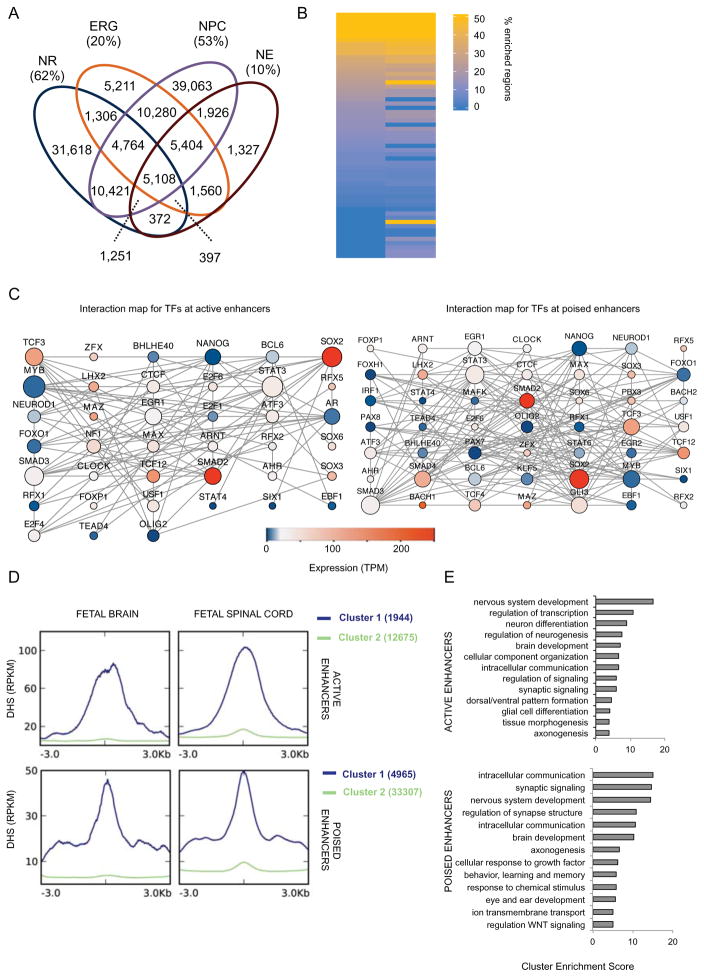
Figure 3. NR regulatory enhancer networks and dynamics during nervous system development.
(A) Venn diagram shows the overlap for all H3K4me1 peaks among NR, NPC, NE and ERG. Fraction of the cell-type unique peaks is also given as percentage of the total number of peaks. (B) Heatmap representation of number (expressed as percentage of the total) of enhancer regions were a motif was significantly enriched (q-value < 0.001). Only motifs whose TF was expressed (TPM>1) in NR are shown. See Table S3A for complete list. (C) In silico protein-protein interaction maps for TFs whose motifs are enriched at active (left) and poised (right) enhancers. Size of node is proportional to the number of interactions; color represents expression value (TPM) of the gene as measured by RNA-seq. (D) Distribution of the average enrichment of DHS signals (RPKM) over 6kb windows centered at active (top) and poised (bottom) enhancers. K-mean clustering (K=2) was used to identify enhancers enriched for DHS (cluster 1, in blue). Cluster 2, in green, represents enhancers lacking enrichment for DHS. (E) Bar plots show the most significantly enriched clusters of GO terms associated with NNGs in Cluster 1 of D. See Table S3C-D for NNGs of active and poised enhancers, respectively. See related Figure S3 and Table S3.

