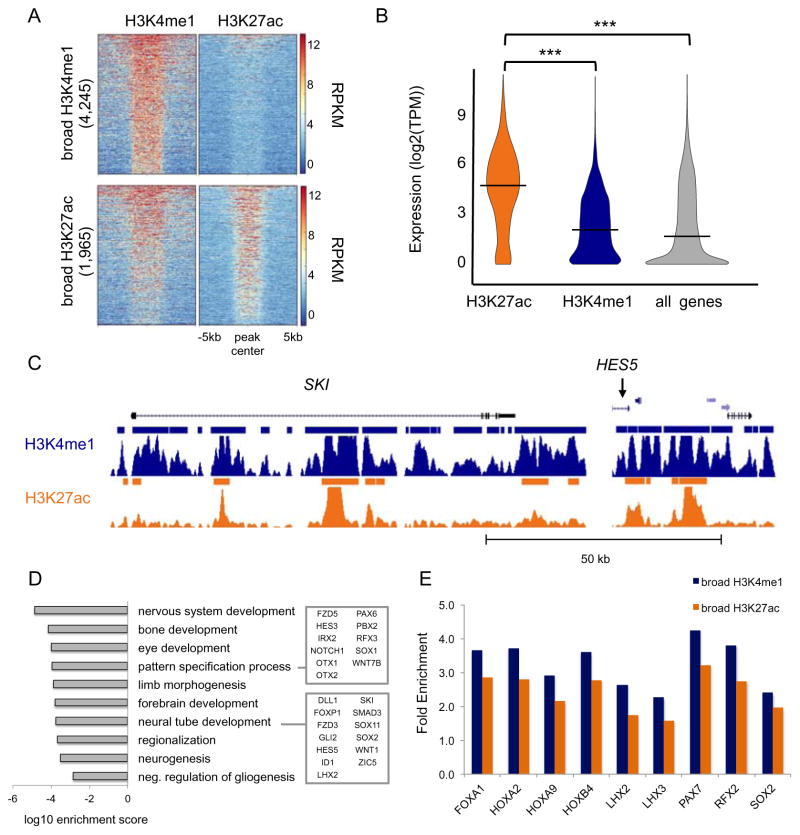
Figure 4. Broad distal regulatory domains reveal master regulators of neural tube formation.
(A) Heatmap representation of the ChIP-seq signal intensity (RPKM, input normalized) over a 10kb window centered at H3K4me1 and H3K27ac peaks across broad H3K27ac peaks (top) and broad H3K4me1 peaks (bottom). (B) Violin plot of distribution of the expression values (log2(TPM)) of the NNGs for broad H3K4me1 (blue) and H3K27ac (orange) peaks. Expression of all genes detected by RNA-seq in NRs is shown as a control. *** ANOVA p-value < 0.0001. (C) UCSC Genome Browser snapshots of SKI and HES5 loci. ChIP-seq signals (RPKM, input normalized) for H3K4me1 (blue) and H3K27ac (orange) are displayed. Solid bars indicate peaks called by MACSv1.4. (D) Bar plot shows the most significantly enriched GO terms associated with NNGs of broad enhancers. (E) Bar plot of TFBS motifs significantly enriched (q-value < 0.001) at broad enhancers versus standard enhancers. Enrichment at broad H3K4me1 (blue) and H3K27ac (orange) regions is expressed as ratio between fraction of broad regions and fraction of standard regions enriched for the given TFBS motif. See related Figure S4 and Table S4.

