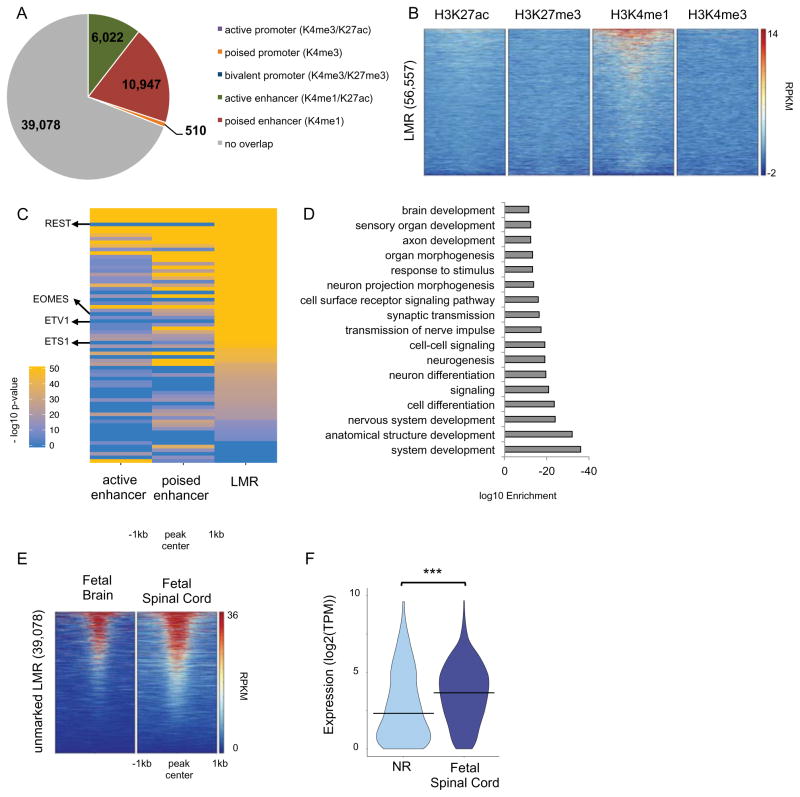
Figure 5. LMR predictions of distal regulatory domains and their developmental dynamics.
(A) Pie chart showing the overlap of LMRs with chromatin-marked promoters and enhancers. (B) Heatmap representation of the ChIP-seq signal intensity (RPKM, input normalized) for H3K4me1, H3K4me3, H3K27me3 and H3K27ac over 2kb windows centered at LMRs. (C) Heatmap representation of negative log10(p-value) for significantly (q-value < 0.01) enriched TF binding site motifs at active enhancers, poised enhancers and unmarked LMRs. Only motifs whose TF was expressed (TPM>1) in NR are shown. See Table S5B. (D) Bar plot of the most significantly enriched GO terms associated with NNGs of unmarked LMRs. See also Table S5C. (E) Heatmap representation of the DHS signal (RPKM) for human fetal brain and spinal cord (18 and 15 weeks of gestation, respectively) over 2kb windows centered at unmarked LMRs. (F) Violin plot of expression (log2(TPM)) of NNGs in NRs and fetal spinal cord (15 weeks of gestation) for unmarked LMRs where REST binding site motif was found to be significantly enriched. *** T-test p-value < 0.0001. See related Figure S5 and Table S5.

