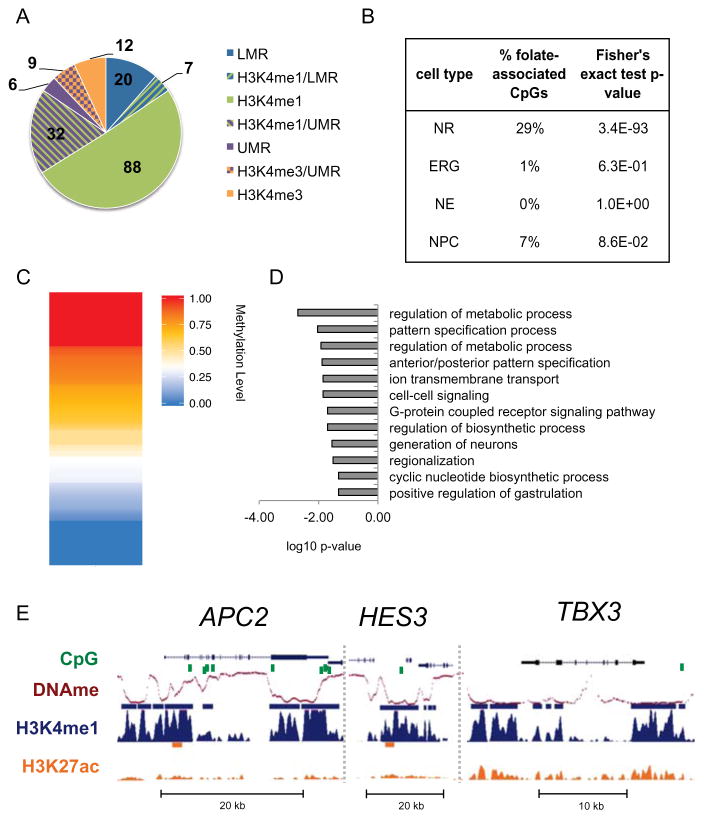
Figure 6. Folate-associated CpGs overlap NR regulatory elements.
(A) Pie chart showing overlap of 174 folate-associated CpGs from Joubert et al., 2016 and NR regulatory elements. Fisher’s exact test log10 p-value < -5 for all overlaps shown. (B) Percentages of the 443 folateassociated CpGs identified by Joubert et al., 2014 overlapping enhancers from NRs and 2D NSCs. Statistical significance of the overlap was calculated using Fisher’s exact test. (C) Heatmap representation of methylation level at the 174 folate-associated CpGs that overlap NR regulatory elements. (D) Bar plot of the most significantly enriched GO terms associated with NNGs of regulatory elements that overlap folate-associated CpGs. (E) UCSC genome browser snapshots of ChIP-seq signals (RPKM, input normalized) for H3K4me1, H3K4me3, H3K27me3 and H3K27ac at some loci that contain folate-associated CpGs. Peaks calls are shown as bars above each track. See related Figure S6 and Table S6.

