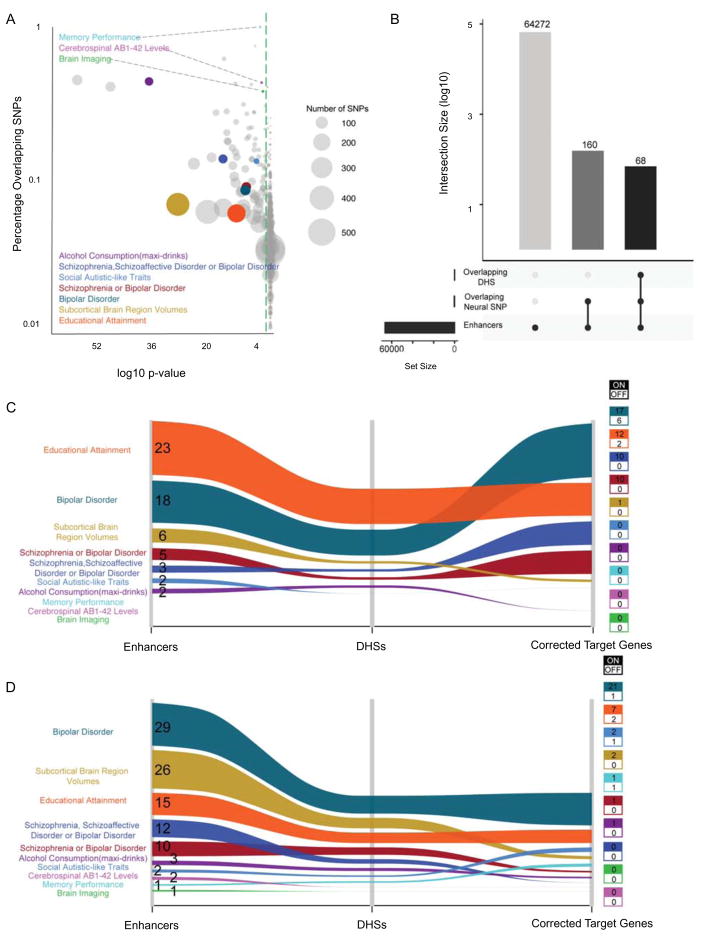
Figure 7. NR enhancers are enriched for genetic variants associated with neurological disorders.
(A) Bubble chart showing traits and conditions from public data (https://www.ebi.ac.uk/gwas/) for which both lead SNPs and SNPs in linkage disequilibrium (r2 ≥ 0.8) were found inside NR enhancers. Circle size represents the number of SNPs overlapped by enhancers for each trait. Colored circles represent traits associated with neurological disorders. Grey circles represent traits not associated with neurological disorders. Green dashed line indicates p-value = 0.05 (hypergeometric test with Bonferroni correction). (B) Bar chart shows number of enhancers overlapping neural related SNPs and DHS (with associated target genes) as represented by bar height. Overlapping conditions are shown by linked dots below bar. (C and D) Alluvial plots showing the number of active (C) and poised (D) enhancers overlapped by neural condition SNPs, overlapping DHS with gene targets and the count of target genes. Colored boxes show the number of target genes expressed (on = TPM > 1) or off.

