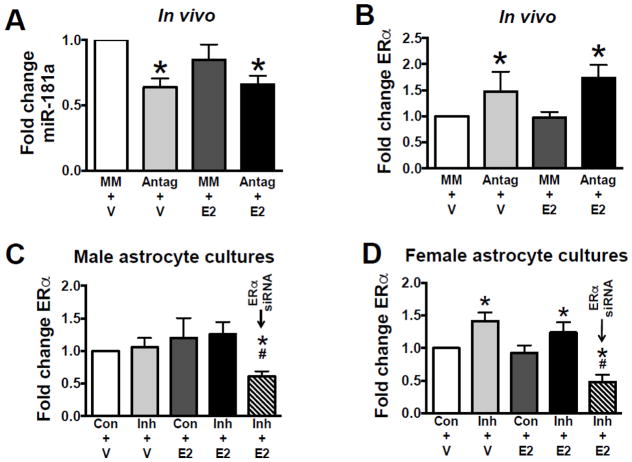
Figure 4. In vivo and in vitro ERα protein expression.
(A) Quantification of miR-181a levels from brains of OVX mice. Quantification of ERα protein from brains of OVX mice (B), male (C) and female (D) primary astrocyte cultures. ERα levels were significantly (p<0.05) lower in cultures co-treated with ERα siRNA (C, D). N = 8 cultures per experiment. All graphs = mean±SE, * = p<0.05 versus control; # = p<0.05 versus all other conditions. Antag = miR-181a antagomir, Con = transfection control (scrambled sequence), E2 = 17β-estradiol, Inh = miR-181a inhibitor, V = vehicle.

