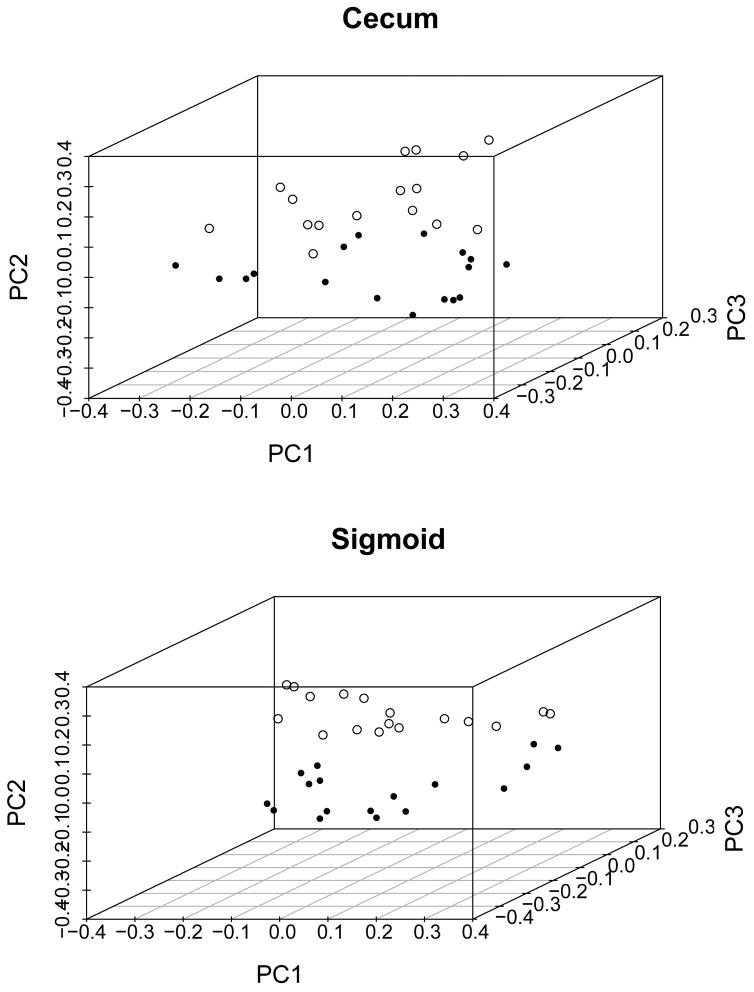
Figure 1. Significant differences in the beta diversity of the SSc and healthy samples as demonstrated by principal coordinate analysis plots of the unweighted UniFrac distance for the cecum (top panel: R2=0.9, P=0.001) and sigmoid (bottom panel: R2=0.9, P=0.001) samples.
Each dot represents a sample from a SSc patient (open circle) or a healthy control (closed circle). The p-values provided were calculated by analysis of variance using distance matrices.

