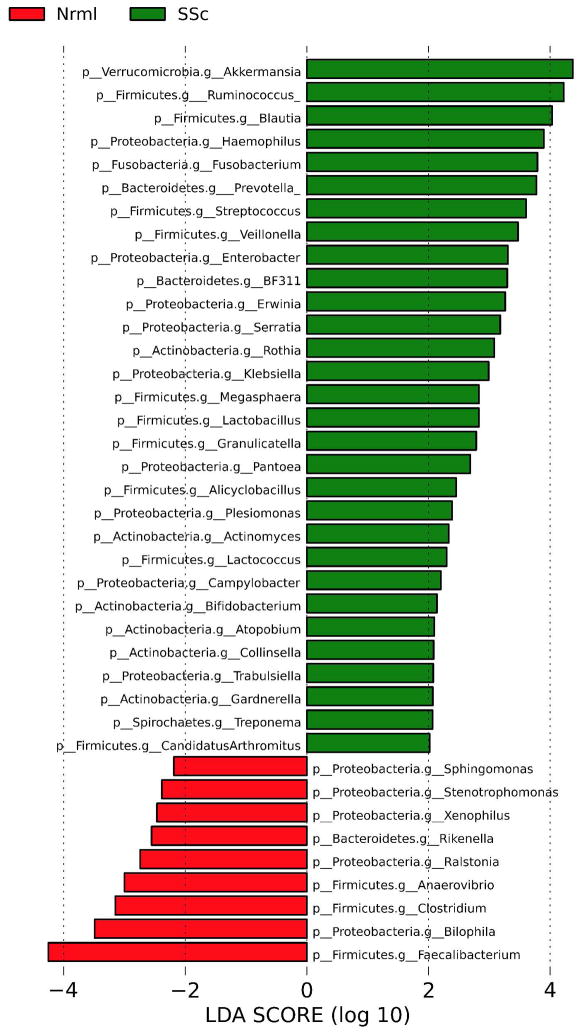
Figure 2. Genus level taxa associated with SSc patients versus healthy subjects in the cecum.
Linear Discriminant Analysis Effect Size (LefSe) multivariate analysis was used to identify significant associations (q<0.1), and Linear Discriminant Analysis (LDA) was used to calculate the effect size for these associations. Negative and positive effect sizes denote genera decreased (red) or increased (green) in SSc patients, respectively.

