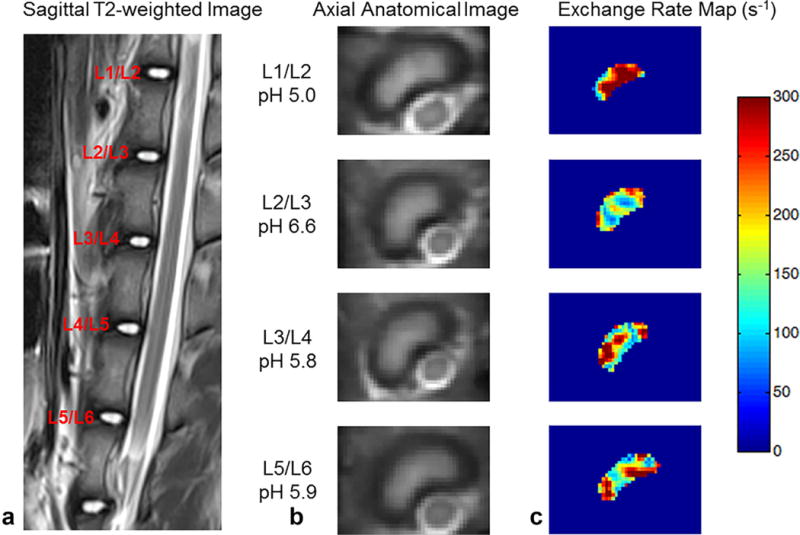
FIG. 3.

Representative images of IVDs and corresponding exchange rate maps in one pig. (a) T2-weighted image in the sagittal plane. (b) Axial anatomical images of corresponding IVDs. (c) Exchange rate maps of corresponding IVDs. The IVDs with lower pH tend to have a higher exchange rate.
