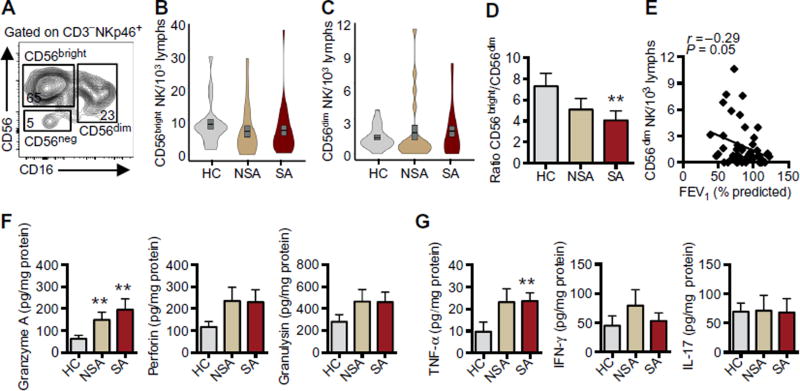
Fig. 2. BAL NK cells are skewed toward a CD56dim cytotoxic phenotype in SA.
BAL NK cells (CD3−NKp46+) were phenotyped by CD56 and CD16 expression into CD56bright, CD56dim, and CD56neg subtypes. (A) Representative flow plot from an asthmatic patient notes percent of total NK cells for each subtype. (B and C) Violin plots (combined box plot and kernel density plot) show the density distribution of CD56bright (B) and CD56dim (C) NK cells in each clinical cohort (gray, HC; tan, NSA; red, SA). Overlaid gray box plots represent means (black line) ± SEM. (D) Ratio of CD56bright to CD56dim NK cells was calculated for each individual. (E) The relationship between CD56dim NK cell number and lung function (FEV1% predicted) was determined in asthma (diamonds), and Spearman correlation r value and significance are noted. Cytotoxic mediators (F) and cytokines (G) were measured in cell-free BALF by cytokine bead array and normalized to protein (see Materials and Methods). Values represent means ± SEM. **P < 0.05 compared with HC by Kruskal-Wallis test and post hoc Dunn’s multiple comparisons test.

