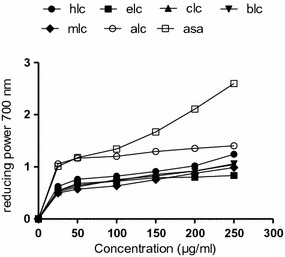
Fig. 2.

Reducing power of various fractions of C. opaca leaves at different concentrations. Each value represents a mean ± SD (n = 3). hlc n-hexane fraction, elc ethyl acetate fraction, clc chloroform fraction, blc butanol fraction, mlc methanol extract, alc aqueous fraction, rt rutin, asa ascorbic acid
