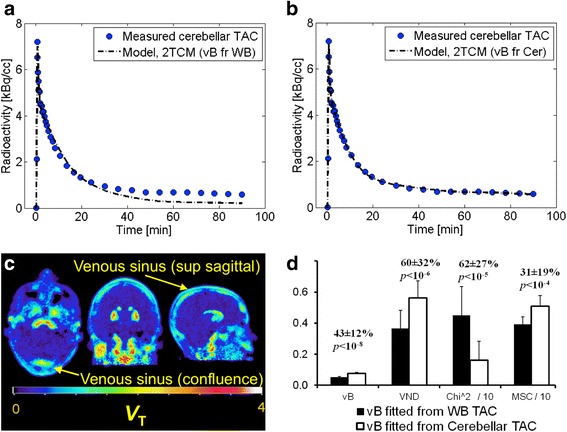
Fig. 1.

a Fit of the 2TCM to the [18F]MNI-659 cerebellar TAC using vB obtained from fitting the whole brain TAC, and b corresponding fit with vB fitted with the rate constants. The improved fit may be related to the high signal from blood vessels, seen in the parametric image shown in c. Fitting vB with the rate constants results in higher vB, higher V ND, lower Χ 2, and higher model selection criteria, shown in d. The numbers above the bars in d displays the percentage difference and the p-value from a paired t-test between the estimates obtained from the two procedures to fit vB
