
Fig. 2.
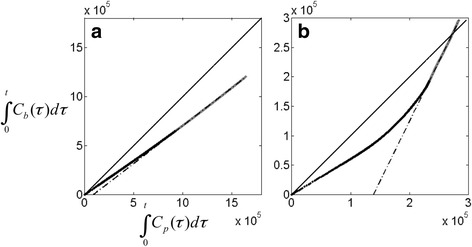
Integrals of whole blood radioactivity plotted against the integral of the metabolite corrected input functions for [11C]raclopride (a) and [18F]MNI-659 (b). For t > t*, the plot becomes linear (gray line), allowing for estimation of α in Eq. (6)