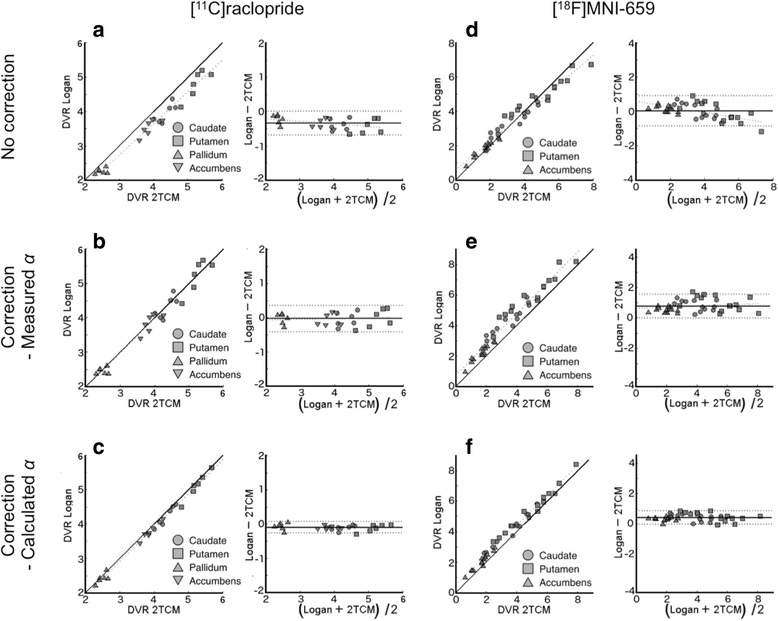
Fig. 5.

Distribution volumes ratios (DVR) obtained with 2TCM plotted against those obtained with Logan ref, and corresponding Bland-Altman plots. DVRs from Logan ref. are: not corrected (a, d), corrected using measured values for α (b, e), and calculated values for α (c, f). Left column (a, b, c) shows [11C]raclopride data, and right column (d, e, f) shows [18F]MNI-659 data
