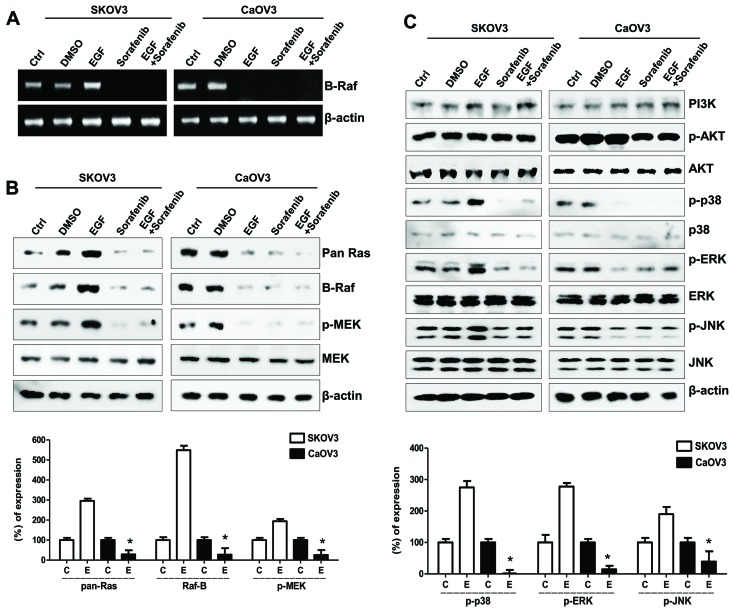
Figure 4.
Effects of sorafenib on the MAPK/ERK signaling pathway in ovarian cancer cells following EGF stimulation. (A) Reverse transcription-polymerase chain reaction analysis of B-Raf mRNA expression levels in EGF-treated ovarian cancer cells. (B) Western blot analysis of Ras, Raf, p- and total MEK protein expression levels in EGF-treated ovarian cancer cells. β-actin served as the loading control. (C) Western blot analysis of EGF-related signaling molecules, including PI3K, p-Akt, total Akt, p-p38, total p38, p-ERK, total ERK, p-JNK and total JNK protein expression levels. Densitometry values of each MAPK and MEK protein were normalized to the total MAPK and MEK protein in the same sample. Densitometry values of Ras and Raf proteins were normalized to β-actin in the same sample. Data are expressed as the mean ± standard error of the mean. *P<0.05 EGF-stimulated Caov-3 vs. SK-OV-3 cells. C, control group; D, DMSO group; E, EGF-treated group; So, sorafenib-treated group; So + E, sorafenib- and EGF-treated group; MAPK, mitogen-activated protein kinase; ERK, extracellular signal-regulated kinase; EGF, epidermal growth factor; p-, phosphorylated; MEK, MAPK/ERK kinase; PI3K, phosphatidylinositol-4,5-bisphosphate 3-kinase; JNK, c-Jun N-terminal kinase.

