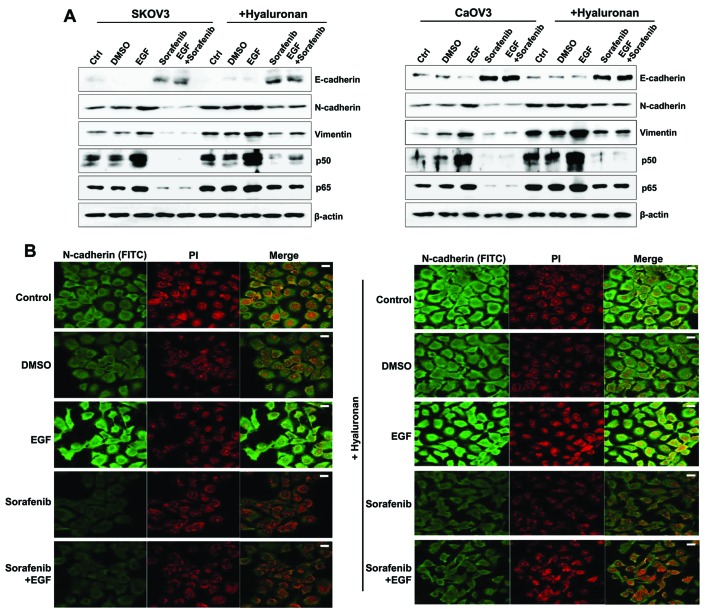
Figure 6.
Mesenchymal phenotype enhancement in EGF-treated ovarian cancer cells following HA stimulation. (A) Western blot analysis was used to assess protein expression levels of E-cadherin, N-cadherin, vimentin and the p50/p65 NF-κB subunits. β-actin served as the loading control. (B) Immunofluorescence was used to visualize Caov-3 cells. Photomicrographs were captured using a confocal microscope under ×200 magnification. The treated cells were incubated with an anti-N-cadherin antibody for 24 h, which was followed by incubation with a FITC-labeled secondary antibody (shown in green). The nucleus was stained with PI and is presented in red. Scale bars, 20 µm. The results are representative of three independent experiments. C, control group; D, DMSO group; E, EGF-treated group; So, sorafenib-treated group; So + E, sorafenib- and EGF-treated group; EGF, epidermal growth factor; HA, hyaluronan; NF, nuclear factor; FITC, fluorescein isothiocyanate; PI, propidium iodide.

