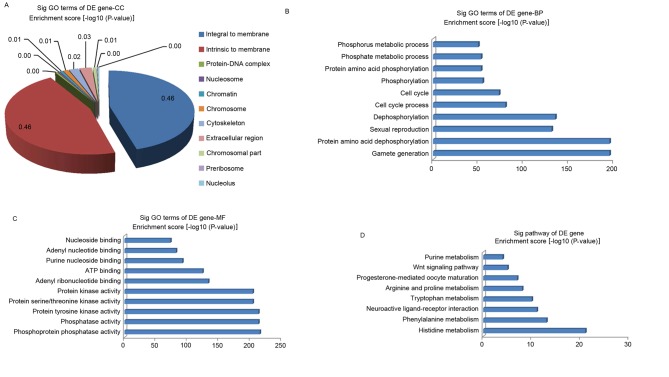
Figure 4.
GO and pathway analysis of DE genes (Database for Annotation, Visualization and Integrated Discovery). GO analysis indicated the (A) CC, (B) BP and (C) MF terms that the DE genes were enriched in. (D) Pathways that DE genes were enriched in, as determined by pathway analysis. GO, gene ontology; DE, differentially expressed; CC, cellular component; BP, biological process; MF, molecular function; Sig, significant.

