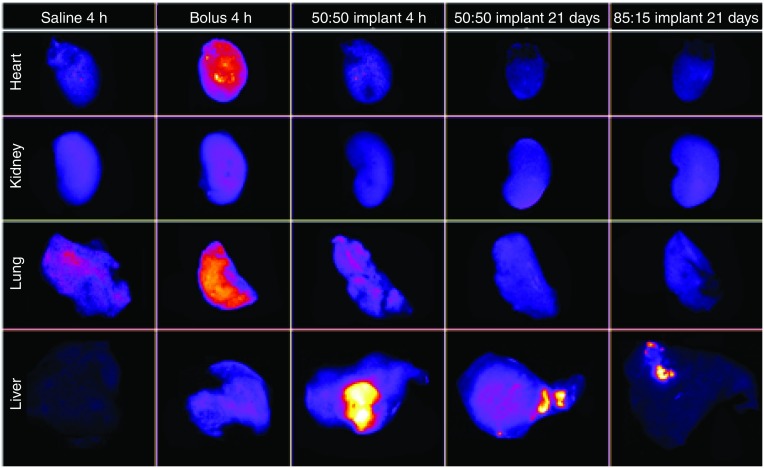
Figure 4. . Representative fluorescence images of whole organs evaluated for biodistribution of doxorubicin.
Column 1 is the saline control, Column 2 is the bolus injection of doxorubicin after 4 h, Column 3 is the 50:50 PLGA implant after 4 h, Column 4 is the 50:50 PLGA implant after 21 days, and Column 5 is the 85:15 PLGA implant after 21 days.

