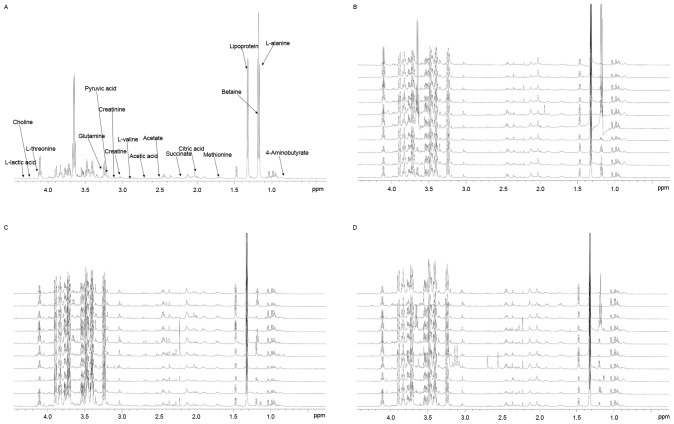
Figure 1.
(A) The spectrum displayed a wide range of metabolites, including lipoproteins, organic acids, amino acids and carbohydrates. Typical 1H-nuclear magnetic resonance spectra of pleural effusion samples from the (B) tuberculous, (C) malignant and (D) transudative pleural effusion groups. The spectra were processed and converted into 400 integral regions of 0.01-ppm width.

