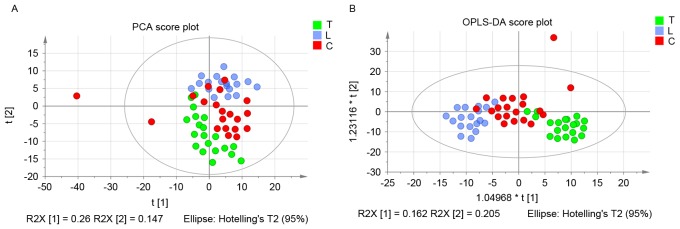
Figure 2.
(A) Score plots of pleural effusion samples demonstrated good separation in the tuberculous, transudative and malignant pleural effusion groups. (B) Statistical validation of the corresponding OPLS-DA model by permutation analysis. PCA, principal component analysis; OPLS-DA, orthogonal projections to latent structures discriminant analysis; T, tuberculous pleural effusion group; L, transudative pleural effusion group; C, malignant pleural effusion group.

