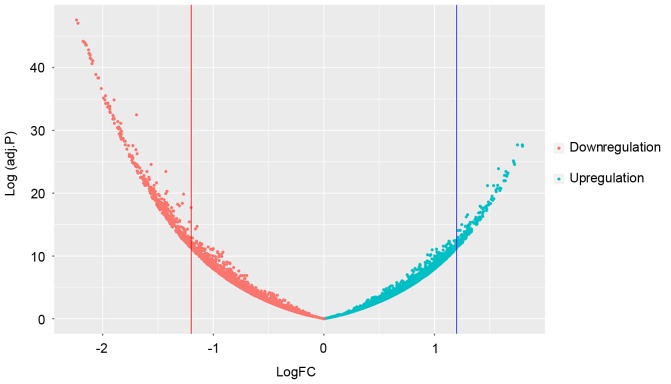
Figure 1.
Volcano plot of genes. The volcano plot indicates the magnitude of differential expression between gastric adenocarcinoma samples and surrounding normal samples. The horizontal line marks the threshold (P<0.01) to define one gene as upregulated (red) or downregulated (blue), combining the change >2 fold.

