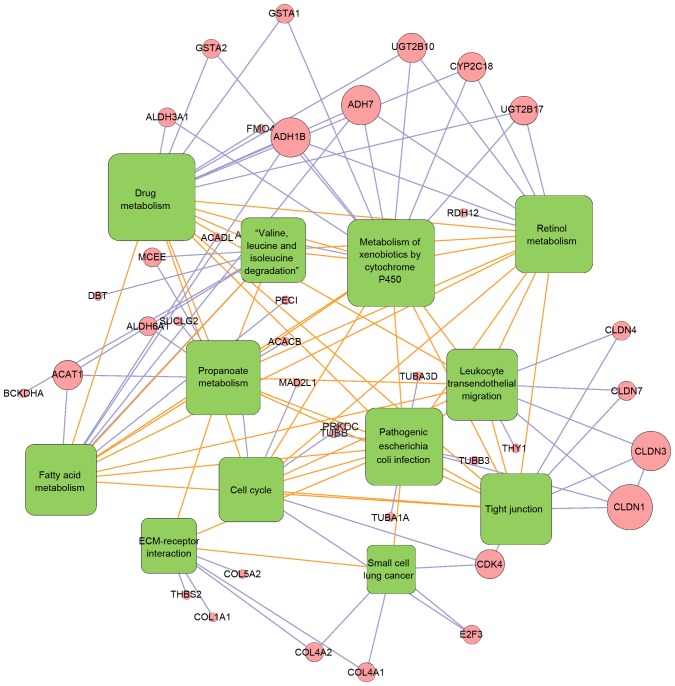
Figure 6.
Pathway-pathway connection network. Pathways are shown in green boxes, genes are in pink circles. The connected pathways of differentially expressed genes are linked by blue lines, while the correlated pathways are linked by orange lines. The size of each hub pathways/genes are the representatives of their degrees in the network.

