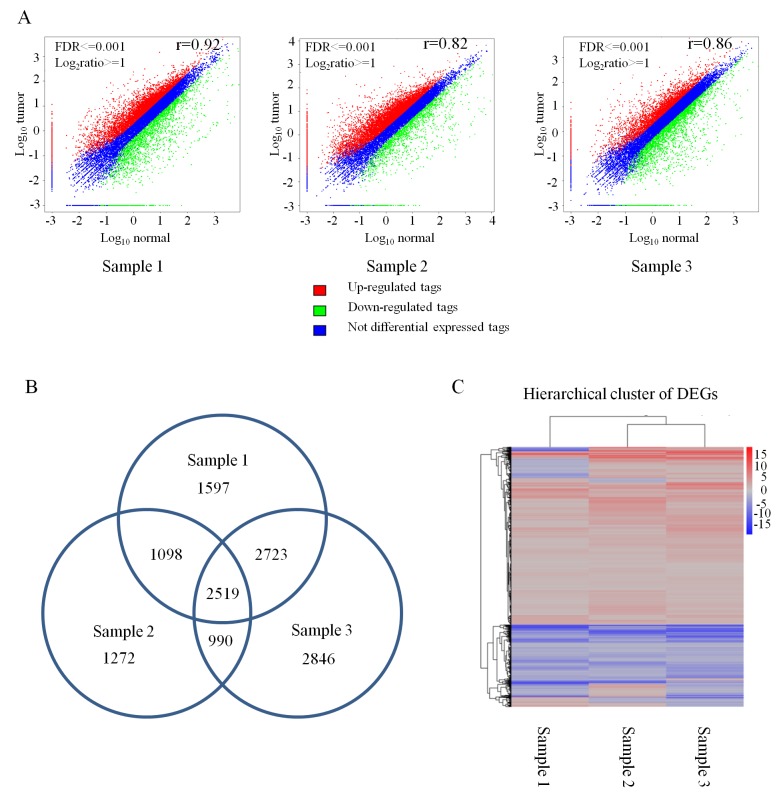
Figure 1.
Analysis of differentially expressed genes in cervical squamous cancer tissues and matched normal tissues. (A) Scatter plots of global expression between cancer and normal samples 1–3 were produced by Pearson correlation coefficient analysis. (B) Venn diagram indicating the overlapping DEGs among the three pairs of samples. (C) Hierarchical clustering of DEGs among cervical cancer tissues and matched normal tissues from the three sample pairs. FDR, false discovery rate; DEGs, differentially expressed genes.

