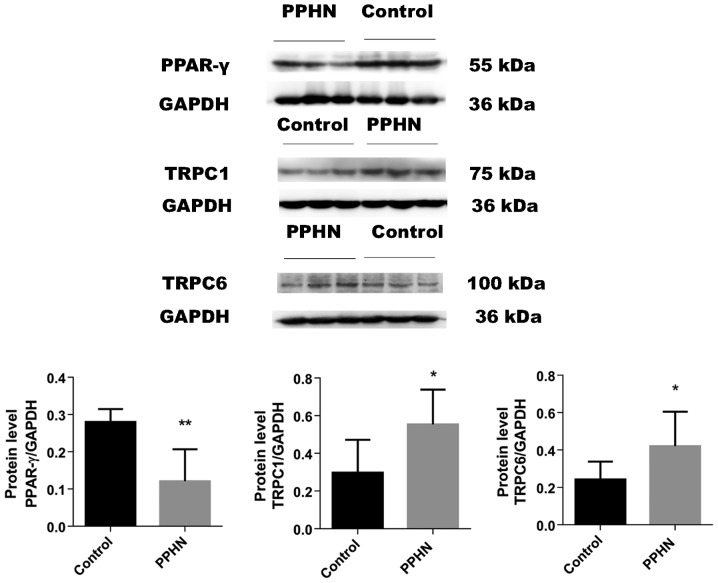
Figure 5.
PPAR-γ, TRPC1 and TRPC6 protein expression analysis. The protein expression levels of PPAR-γ, TRPC1 and TRPC6 were measured by western blotting, and the intensity of the bands was normalized to GAPDH. Data were presented as the mean ± standard deviation; n=8/group; *P<0.05 and **P<0.01 vs. Control. PPAR-γ, peroxisome proliferator-activated receptor γ; PPHN, persistent pulmonary hypertension of the newborn; TRPC, transient receptor potential cation channel.

