
Figure 2.
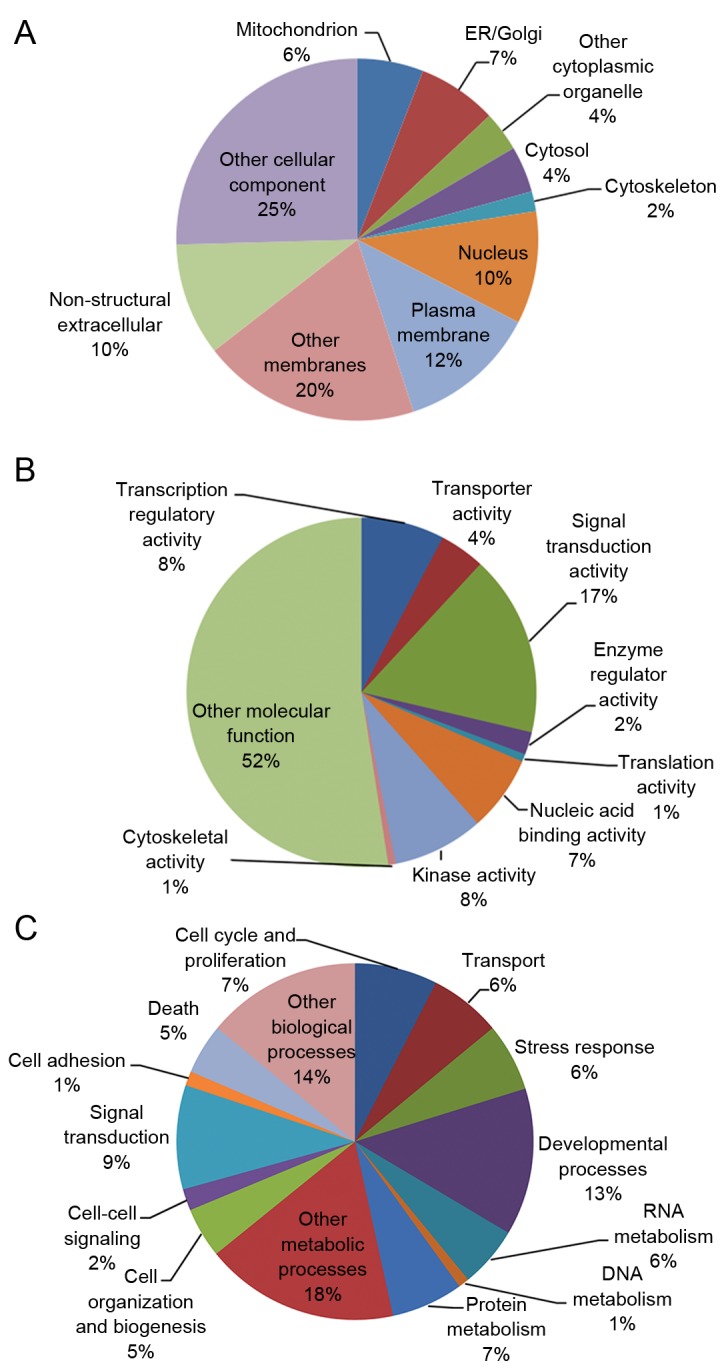
Gene ontology analysis of G6PD-associated genes. Each pie chart represents the (A) cellular components (B) molecular functions and (C) biological processes of G6PD-associated genes. G6PD, glucose-6-phosphate dehydrogenase; ER, endoplasmic reticulum.