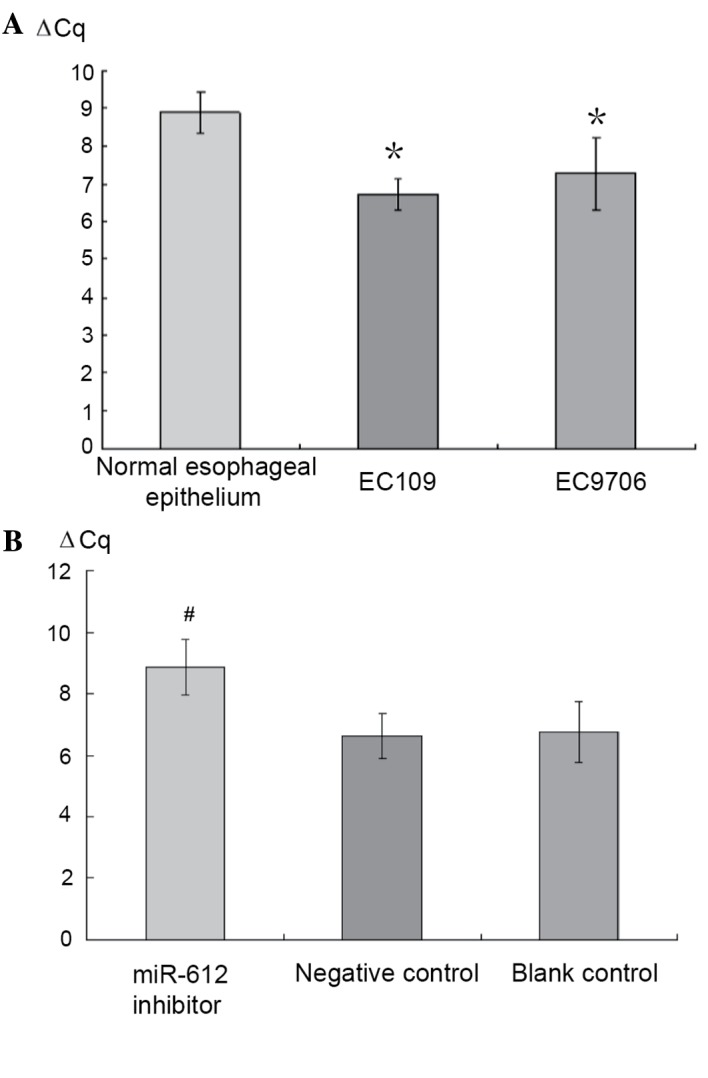
Figure 3.

Reverse transcription-quantitative polymerase chain reaction analysis was used to validate the expression of miR-612 in (A) normal esophageal epithelium, cancer cell line EC109 and EC9706 cells and in (B) synthesized miR-612 inhibitor, negative control and blank control. EC109 and EC9706 had increased expression of miR-612 when compared to the normal esophageal epithelium (4.49- and 3.05-fold higher). The group with the miR-612 inhibitor had significantly reduced expression of miR-612, while the two control groups essentially had no change. Data are presented as means ± standard deviation *P<0.05 vs. normal group; #P<0.05 vs. negative and blank control groups. miR, microRNA.
