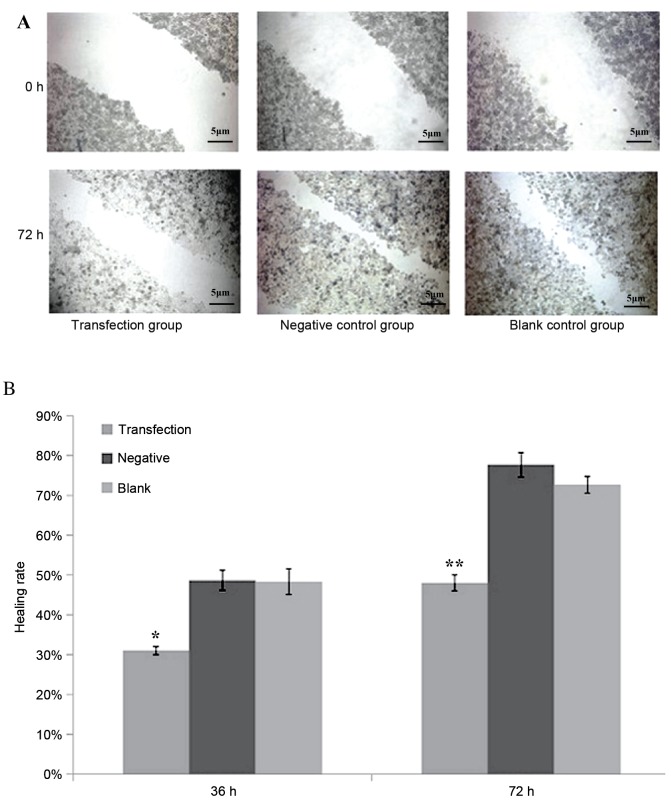
Figure 4.
(A) Scratch test of the transfection group, negative control group and blank control group at 0 and 72 h. The transfection group had a significantly reduced healing rate than in the negative control or blank control group 72 h after scratch. (B) Scratching healing rates at 36 and 72 h among three experimental groups. The transfection group has significant lower healing rate than the negative control or blank control group. Data are presented as means ± standard deviation. *P<0.05 and **P<0.01 vs. negative and blank control groups.

