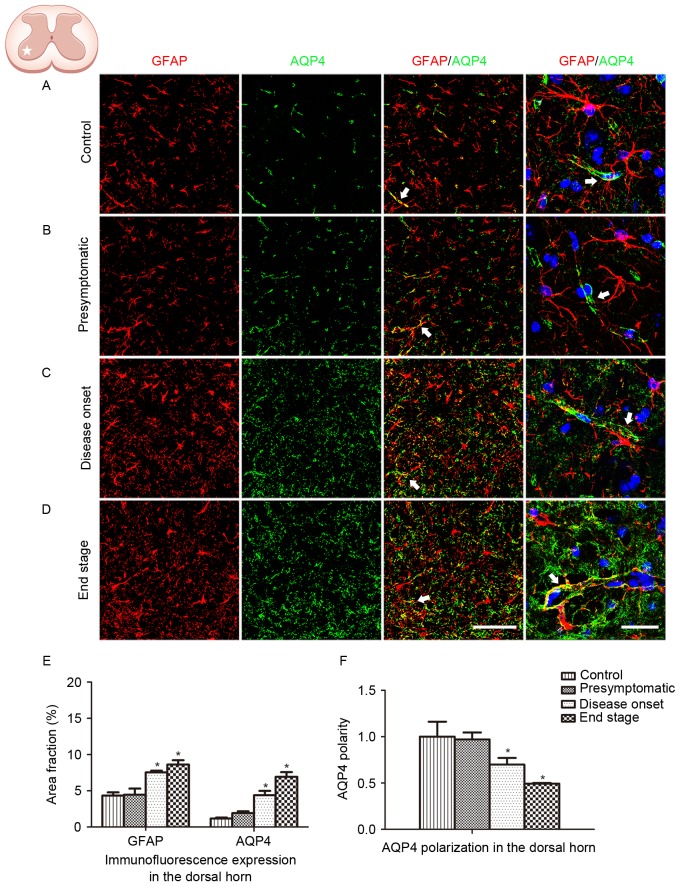
Figure 3.
GFAP and AQP4 expression and localization in the ventral horn of the cervical spinal cord. (A) GFAP and AQP4 expression and localization in control animals. (B) GFAP and AQP4 expression and localization in SOD1G93A mice at the presymptomatic stage. (C) GFAP and AQP4 expression and localization in SOD1G93A mice at the disease onset stage. (D) GFAP and AQP4 expression and localization in SOD1G93A mice at the end stage. The arrows indicate areas of positive AQP4 staining. Scale bars, 150 µm for the left three columns and 75 µm for the far right column. (E) GFAP and AQP4 expression was quantified at the presymptomatic, disease onset and end stages using the area fraction (percentage of GFAP or AQP4 immunoreactivity in the overall field). Increased global expression of GFAP and AQP4 was observed as the disease progressed. (F) AQP4 polarization decreased as the disease progressed. *P<0.05 vs. wild type control (one-way analysis of variance; n=5 animals/group). GFAP, glial fibrillary acidic protein; AQP4, aquaporin-4; SOD1, superoxide dismutase 1.

