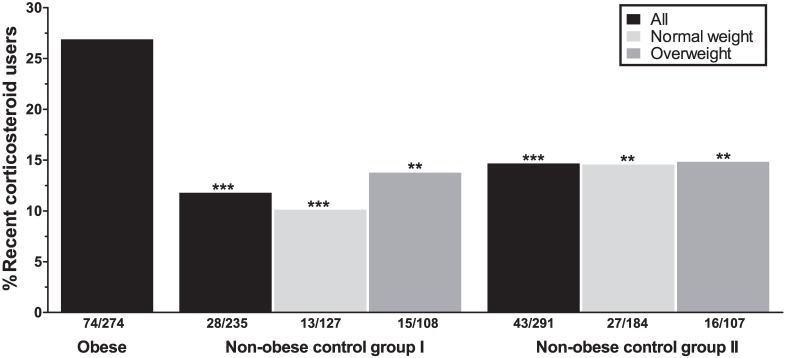
Figure 1.
Recent corticosteroid use in obese and non-obese subjects. Analyses between the obese group and the non-obese control groups as a whole (black bars), or stratified for two weight classes (light gray = normal weight, dark gray = overweight) are controlled for sex and age. All asterisks depict P-values for the comparisons with the obese group. **P<.01, ***P<.001.

