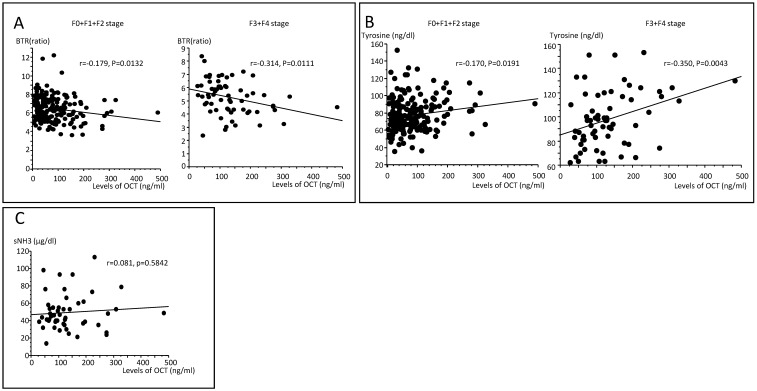
Figure 2.
(A) Correlations between the molar ratio of branched-chain amino acids to tyrosine (BTR) and OCT concentrations in serum according to F0+F1+F2 and F3+F4 stages. A significant correlation was seen only for patients with F3+F4 disease (r=-0.314, P=0.0111). (B) Correlations between tyrosine and OCT concentrations in serum according to F0+F1+F2 stages and F3+F4 stages. A significant correlation was seen only for patients with F3+F4 stage disease (r=-0.350, P=0.0043). (C) There was no association between serum NH3 and OCT concentrations in patients with F3 and F4 stage disease (r=0.081, P=0.5842).

