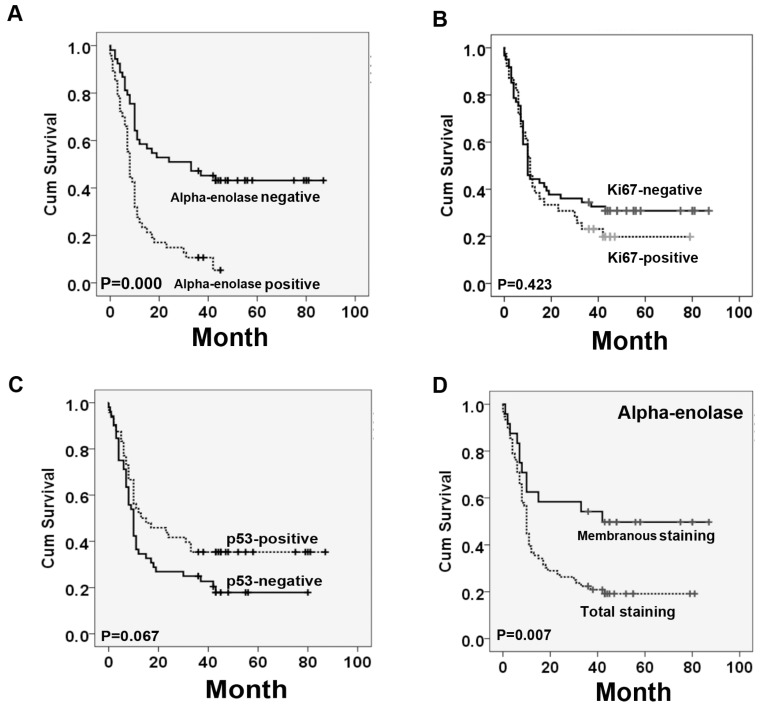
Figure 3.
Survival curves for pancreatic cancer using the Kaplan-Meier method and the log-rank test. A. Overall survival curves for patients with negative Alpha-enolase expression (real line) and patients with positive Alpha-enolase (dotted line). B. Overall survival curves for patients with negative ki67 expression (real line) and patients with positive ki67 expression (dotted line). C. Overall survival curves for patients with negative p53 expression (real line) and patients with positive p53 expression (dotted line). D. Overall survival curves for patients with Alpha-enolase membranous expression (real line) and patients with Alpha-enolase total expression (dotted line).

