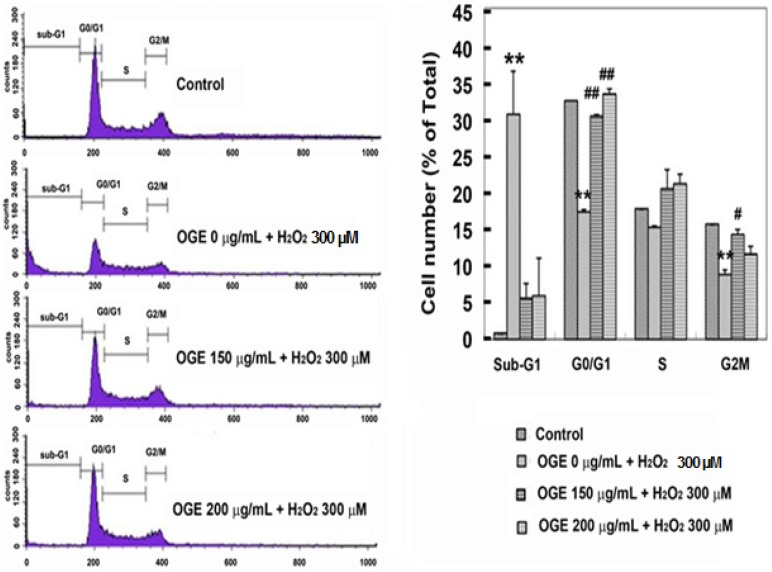
Figure 2.
Effects of OGE on the cell cycle distribution in H2O2-treated cells. RSC96 cells were pretreated with 150 and 200 μg/mL OGE for 24 h and challenged with 300 μM H2O2 for 12 h. Data are means ± S.E. (n=3). **p<0.01 indicates significant difference compared with the control group; #p<0.05 and ##p<0.01 indicate significant compared with the H2O2 group

