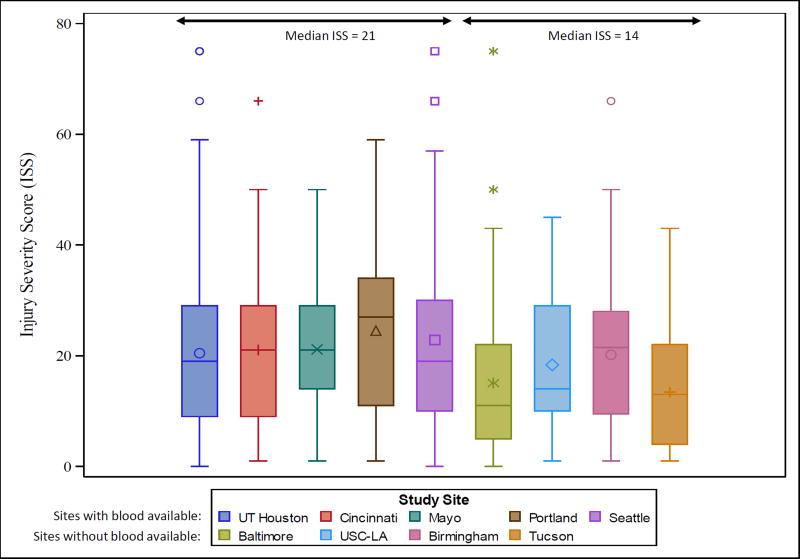
Figure 1. Distribution of ISS for study sites.
Figure 1 presents boxplots of the distribution of ISS for each center of the study. Note that the medians of the sites with blood available on the helicopter all have distributions that are shifted higher than those of the sites without blood available. This shift shows that the ISS of patients arriving to sites with blood available prehospital are generally higher than the ISS of patients arriving to sites without blood available prehospital.

