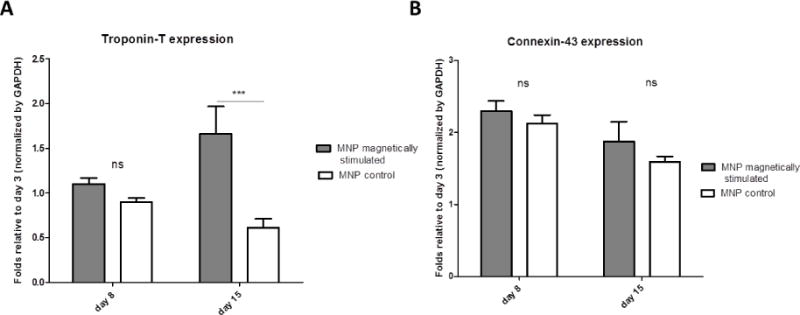
Figure 6.

Expression of representative cardiac cell markers by Western blots. Protein expression is presented as relative to day 3 before stimulation, for (A) cardiac Troponin T, (B) Connexin-43. Asterisks denote significant difference (by 2-way ANOVA), *p < 0.05, **p < 0.01 and ***p < 0.005 (Bonferroni’s pos-hoc test was used for comparison between the groups), ns represents non-significant difference.
