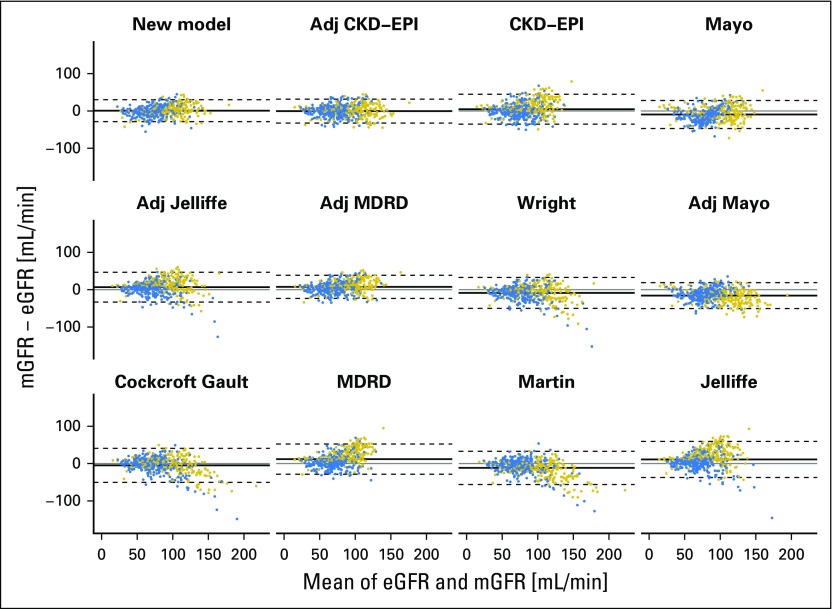
Fig 2.
Bland-Altman plots of estimated GFR (eGFR) and measured GFR (mGFR) for the new model and each of the published models. The mean of mGFR and eGFR was plotted against the difference of the two for the internal validation data set. Positive differences indicate underestimation and negative differences indicate overestimation. The plots are ordered in ascending order of root-mean-squared error of eGFR from top left to bottom right. The solid line on each plot represents the mean of the difference and the dashed lines are drawn at the mean ± 1.96 times the standard deviation of the difference. Points are colored by sex (blue, female; gold, male). Adj, adjusted; CKD-EPI, chronic kidney disease epidemiology; MDRD, Modification of Diet in Renal Disease.

