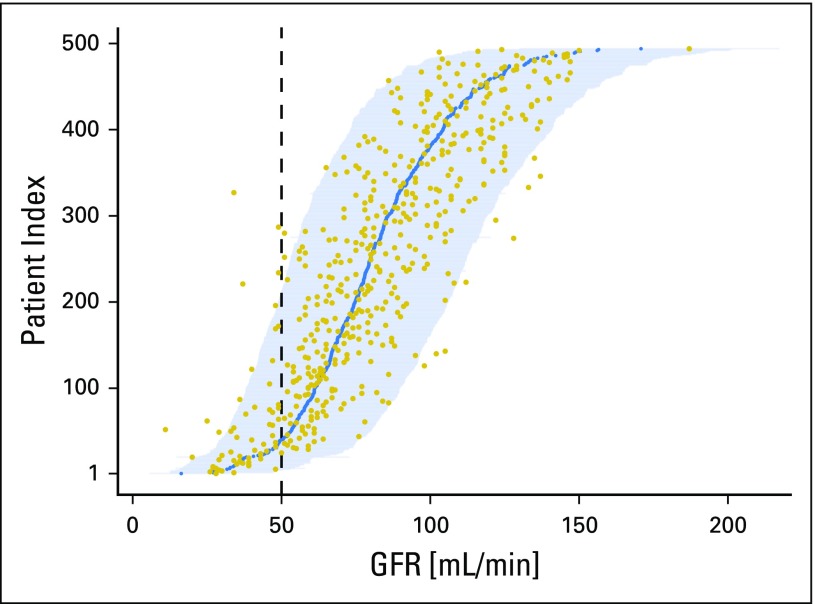
Fig 4.
Predictive CIs for glomerular filtration rate (GFR) of each patient in the internal validation data set. To obtain this figure, the new model fitted on the development data set was applied to all patients in the internal validation data set. The measured GFR (gold points) and the estimated GFR (blue points) for each patient are illustrated. Each horizontal line represents a 95% predictive CI for the patient, with patients ordered in accession by their estimated GFR. The vertical dashed line highlights the boundary at a GFR of 50 mL/min, below which cisplatin administration would be considered with caution by most clinicians. Of the 494 patients in the internal validation data set, 24 (4.9%) had measured values outside their prediction interval.

