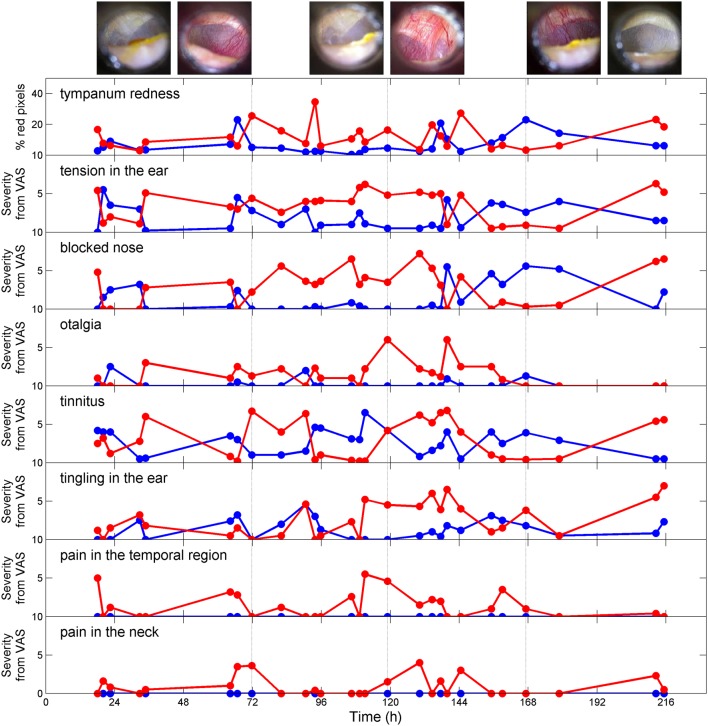
Figure 1.
Severity of acoustic shock symptoms (assessed by VAS) as a function of time. The blue line represents the left ear and the red line represents the right ear. Examples of tympanum pictures are shown at the top (left images: left ear; right images: right ear, the vertical lines corresponds to the time at which the pictures were taken).

