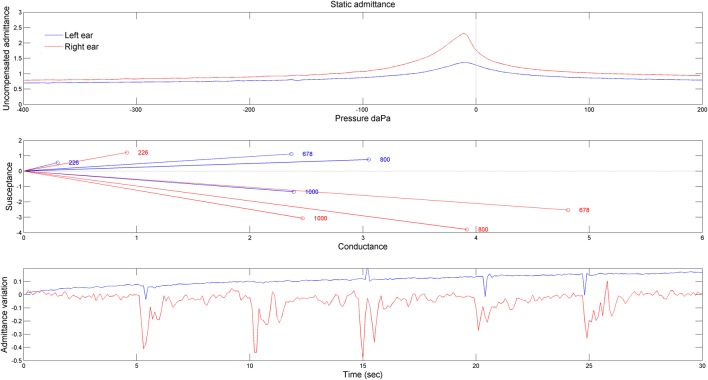
Figure 3.
Results obtained by tympanometry measurements. The upper panel shows the static admittance for the two ears obtained for a 226 Hz probe. The middle panel shows the susceptance as a function of the conductance at four frequencies of probe tone stimulation (226, 678, 800, and 1,000 Hz). The bottom panel shows the admittance variation when the patient blinked voluntarily (but not forcefully) his eyes. The patient was asked to do so every 5 s (blue line: left ear, red line: right ear).

