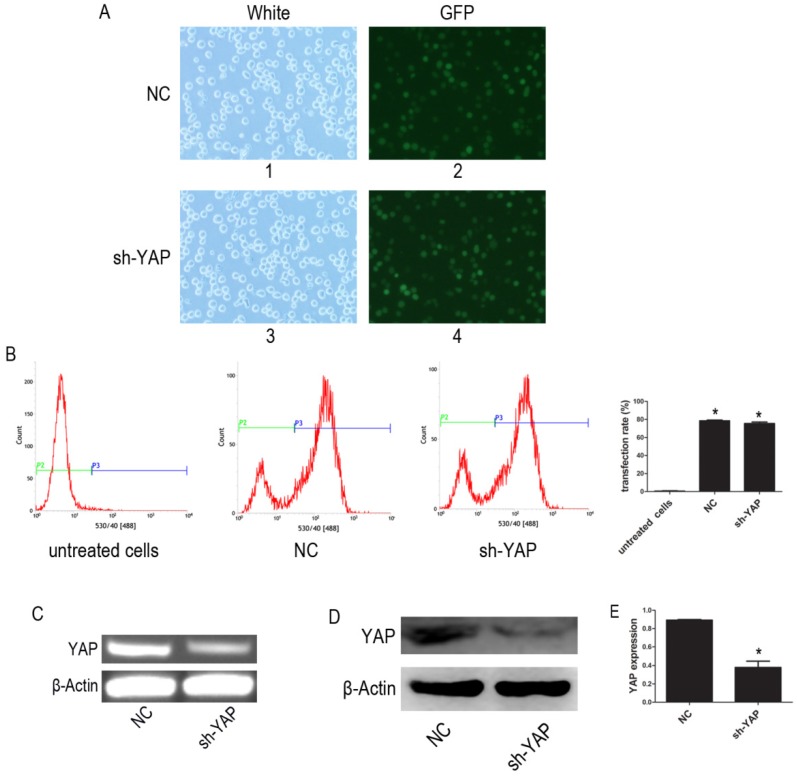
Figure 1.
Knock down YAP of HL-60 cell. (A) 1 and 3, light microscopy; 2 and 4, fluorescent microscopy. 1 and 2 images of HL-60 cells were transfected with negative control lentivirus; 3 and 4 images of HL-60 cells were transfected with YAP-shRNA (×20). (B) The transfection efficiency was tested by FCM. (C) The mRNA level of YAP was tested by RT-PCR. (D) The protein expression of YAP was detected by western blot. (E) Quantitative analysis was performed by measuring the relative protein expression level of YAP to β-Actin. Data are expressed as means ± SD. *P < 0.05.

