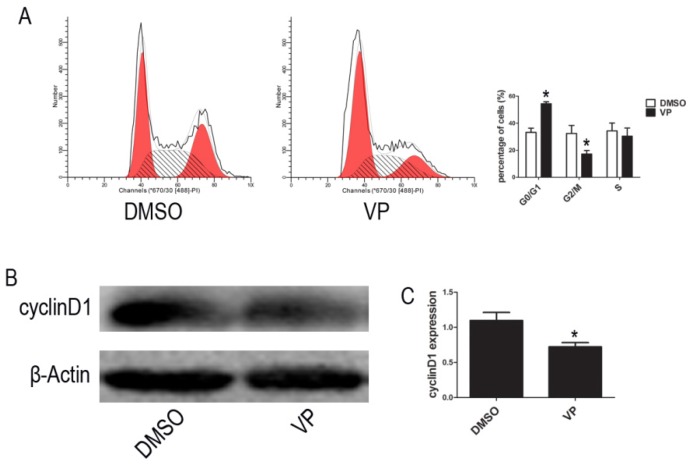
Figure 6.
VP affects cell cycle. (A) Cell cycle distribution was tested by FCM. (B) The expression level of cyclinD1 was determined by western blot. (C) Quantitative analysis was performed by measuring the relative expression level of cyclinD1 to β-Actin. Data are expressed as means ± SD. *P < 0.05.

