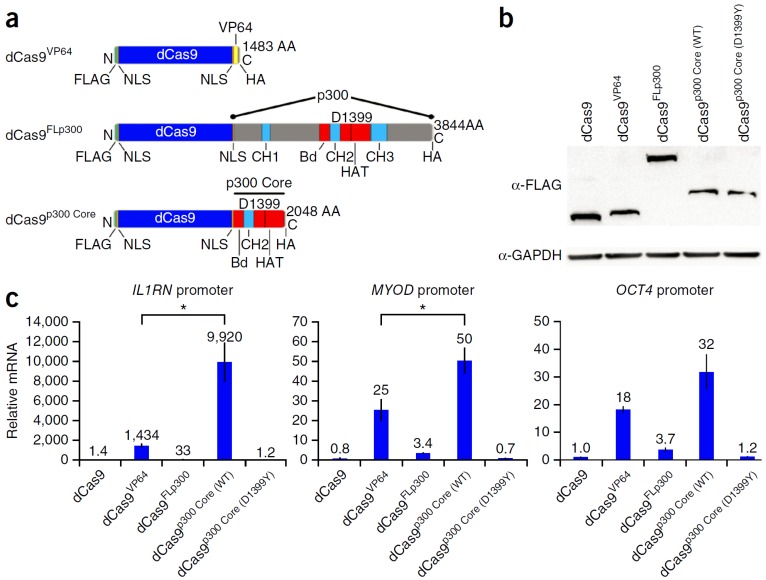
Figure 5.
Schematic diagram of dCas9 DNA binding domain fused to activation domain, p300, and p300 core (a). Western blot in cells transfected with the dCas9 fusion proteins (b). Relative mRNA expression of IL1RN, MYOD, and OCT4 in HEK293T cells (c). Adapted by permission from Macmillan Publishers Ltd: Nature Biotechnology (66) copyright (2015)

