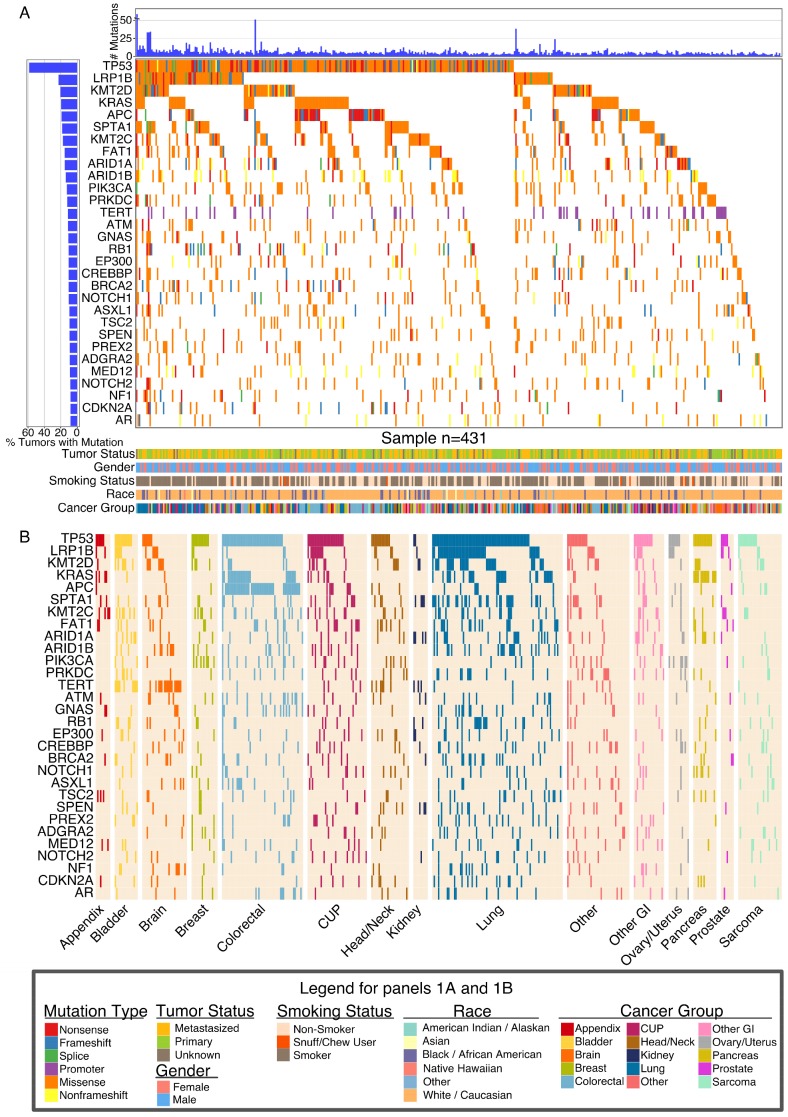
Figure 2.
Global Landscape of Somatic Mutations. (A) Global somatic mutational landscape of all patients for the top 30 genes having the largest fraction of mutations. Top and left bar charts show the number of mutations and percent of mutated samples, respectively. The lower part of panel A summarizes clinical information from each patient. (B) Somatic mutational landscape for major cancer groups for the same 30 genes seen in (A). Cancer group-wise mutational patterns show large similarities (TP53) but also striking differences (KRAS, APC, TERT) between cancer groups.

