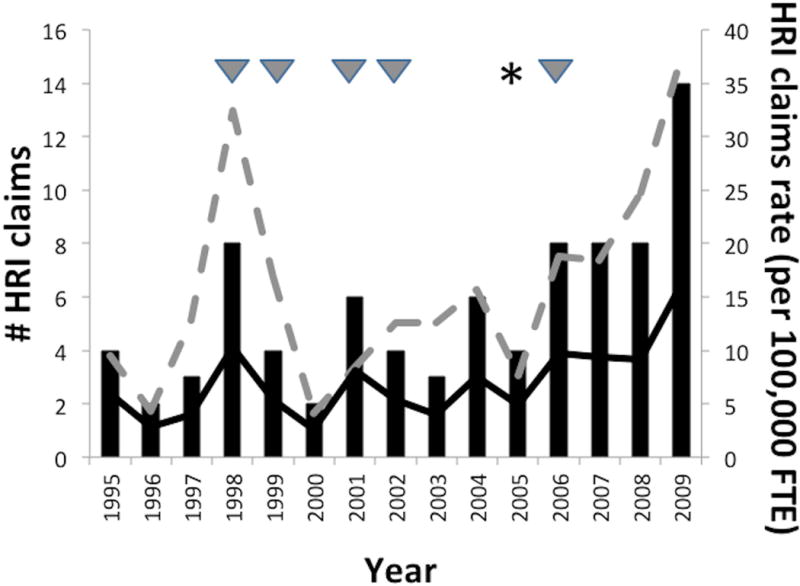
Figure 1. Washington State Fund agriculture and forestry workers’ compensation heat-related illness (HRI) claims and claims incidence rates by year, 1995–2009.

Black bars: number of HRI claims; Solid line: annual HRI claims incidence rates per 100,000 full-time equivalents (FTE); Dotted line: annual third quarter (July, August, and September dates of injury) HRI claims rates; triangles above bars: years characterized by severe claims (inpatient hospital admissions but not deaths); Asterisk above bar: year in which a death occurred.
