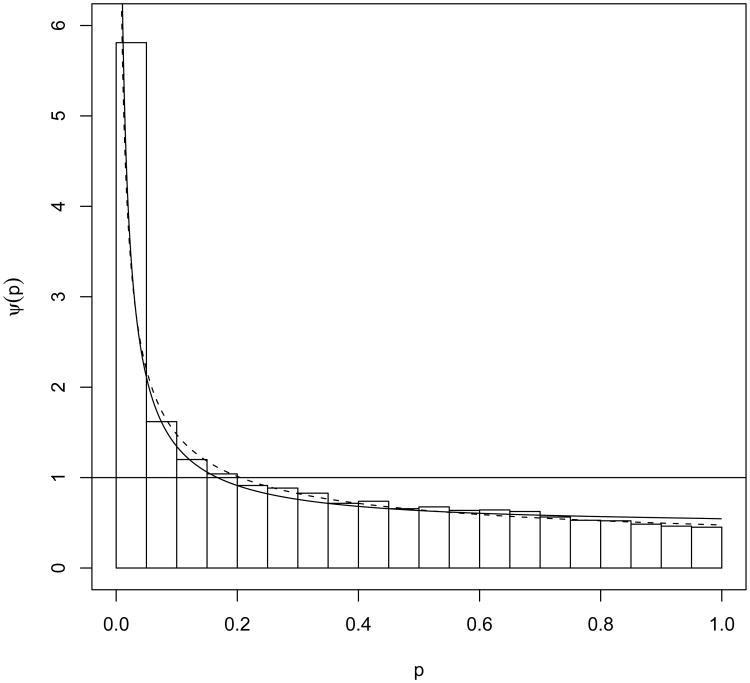
Figure 10.
Two fitted parametric models to the MALT dataset analyzed in Pounds and Morris (2003). The solid line is the fitted mixture model (5) with (3) as the non-null component ψ for the chi-squared test. The dashed line represents the fitted beta uniform mixture model of Pounds and Morris (2003).

