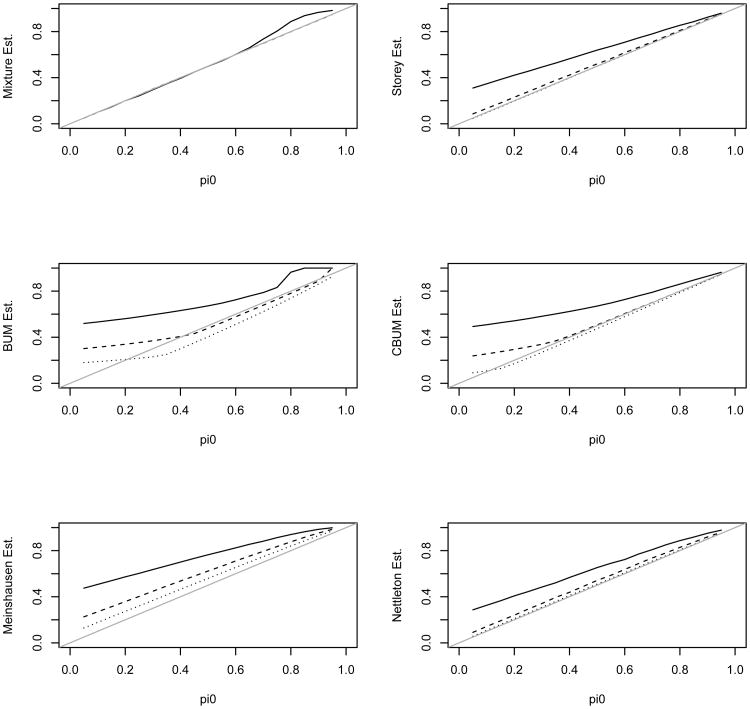
Figure 2.
Estimated π0 using the 6 different methods versus the true π0. The solid, dashed, and dotted lines are for λ value of 4, 9, and 16 in the alternative, respectively. The tests are independent from each other. Note, the mixture estimate is almost identical with the true π0 for λ value of 9 and 16.

